Ahead of the curve, where Amazon's next UK warehouse could close
In this note we use Kania Advisors geolocation analytics platform for logistics real estate to evaluate potential markets and locations across Amazon’s UK distribution warehouse network that could be exposed to weakening consumer and retail conditions. While we use Amazon to illustrate some key concepts, the platform provides analytics and ongoing live monitoring across a range of dimensions such as markets, locations, portfolios or single assets or any geolocation or user defined geography. In addition, our database of over 2,000 institutional quality logistics assets across Europe allows users to both benchmark relative performance and competitive position of their assets within respective market.
As the logistics sector enters a new phase of market cycle and dynamics, the balance begins to tilt from a beta-exposure that accelerated general market growth and asset values relatively uniformly over the past decade or so, to geolocation specific aspects that have become critical for successful investments, identifying build-up of tail-risks and for ongoing management of logistics real estate exposures.
Amazon is generally considered an indicator for both the online economy and demand for real estate distribution assets given it’s market position and prime locations. However, Amazon has expanded rapidly during the “market-beta” phase and possibly also over-expanded. A year ago, in January 2023, the company announced plans to shut three of its UK warehouses located in Doncaster, Hemel Hempstead and Gourock.
With most recent retail sales reported by ONS as of November showing further consumer weakness year-on-year, All Retail Sales for the past 12 months were down by -3.2% and Non-Store Retail Sales were down by -5.6% compared to the 12 months ending November 2022, in this note we evaluate which Amazon locations may be considered “weak” should the company have further plans to reduce its distribution network footprint.
We have discussed the importance of the flow of goods across cargo handling locations and the flow of transport across major distribution roads within a market or location as key drivers of demand and performance of logistics real estate assets (see previous notes). We have also discussed the impact of those flows on future rental growth through demand dynamics and the leading information characteristics of approximately 1-1.5 years in advance of rental growth changes. Here we apply those flow metrics together with population catchment within drive-times of each Amazon warehouse location to identify any signs of potential weakness or underperformance of individual assets within the company’s distribution network. We use the following metrics: (“asset market” is defined as 60 minute drive-time from asset location)
flow of goods through cargo handling locations within the asset market
flow of transport on main distributions motorways both within the asset market and within a 10km radius of the asset location
consumer reach within 30 minutes drive-time and within asset market
Fig 1a and 1b illustrate consumer catchment areas of Amazon’s distribution warehouse network for 60min and 30min drive-time areas. We estimate that Amazon can reach ca 39.7m consumers within 60min and ca 13.7m within 30min drive times (ca 59% and 20% of population respectively).


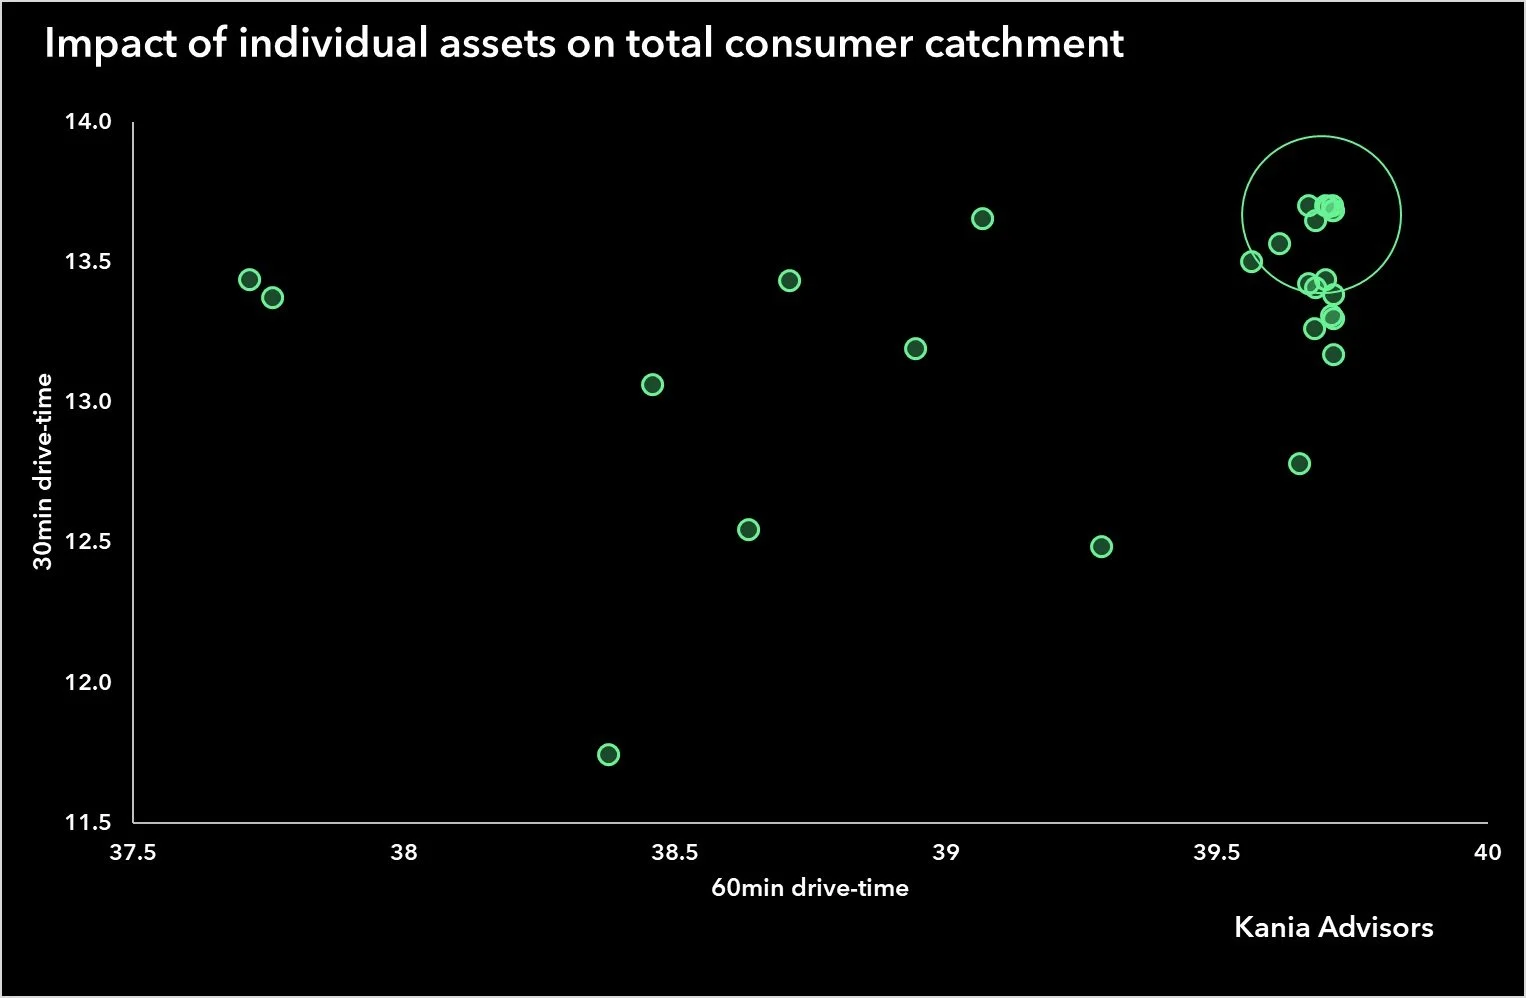
As a first step we evaluate how critical each asset is for the company’s overall UK footprint by removing it from the network and re-calculating the aggregate consumer catchment. We do this for both the 60min and 30min drive-times to capture density overlaps and differences in overall capacity of individual assets.
Fig 2 illustrates the results with a matrix of consumer reach reduction that is caused by removing individual assets. Assets located in the top-right are unlikely to be strategic within the network as removing those does not have any meaningful impact on overall consumer reach. Removing assets that are further down and to the left of the figure would have a significantly higher impact on overall consumer reach and therefore are less likely to be impacted by cyclical conditions only. The top-right is the initial cluster of assets that could potentially become less important if the flow of goods in the relevant market and/or transport activity in the vicinity of those assets begins to decline in a meaningful way. Also, more than one asset can be located such that overall existing capacity is not needed within the area; e.g. Amazon has multiple sites in Doncaster where one of the announced closures was located.
It should be noted that although flow of goods and transport distribution activity are related they are not necessarily highly correlated as e.g. a significant volume of goods is transported on roads over large distances and not necessarily from nearby cargo handling facilities. As we have discussed in previous notes, both metrics are significant and complementary leading indicators for overall demand for logistics space.
Cargo volumes have generally remained weak across locations and while most have recovered somewhat from initial COVID impact, ,most remain below pre-COVID levels although also relatively stable over the past 1-1.5 years.

Road transport activity in the radius of Amazon’s assets has shown a possibly more synchronised although not equal recovery to reach roughly pre-COVID levels around end of 2022 and earlier half of 2023. However we estimate that transport flows on major motorways have decelerated markedly during Q3 to a negative year-on-year figure of -4.4% and to -8% as of December (not very different from reported retail sales figures as above which we would expect to print lower as of coming releases, given these road transport figures)
As both flow figures illustrate, although the is a general softening of demand drivers across markets and locations there is a meaningful spread across both metrics indicating that there is a potentially meaningful divergence accumulating which, if generally weaker conditions persist, could trigger further assessments of capacity across the warehouse network.
Based on these combined conditions and leading indicators of logistics activity, we have ranked Amazon’s, what we consider as per above, non-strategic assets and produced a list of relative performance of locations that may begin to introduce tail-risks into the overall network capacity and which may not be required if market conditions do not improve or if those locations continue to lag in activity for a prolonged period of time.
The figure below illustrates a single non-strategic asset that scores negative on all three dimensions of marginal consumer change, cargo locations flow and transport activity flow in asset radius. The scale has been normalised. Additional two assets show low marginal consumer reach impact and at the same time experience negative cargo flows however have slightly positive road transport activity on a relative basis and are therefore not show.

To discuss this research, please contact info@kaniaadvisors.com
Kania Advisors logistics analytics is built to provide allocators and investors with live access to monitor logistics activity that drives market rents and asset values from macroeconomic conditions to specific geolocation. The analytics tracks any market, any location and any asset (or potential asset such as land plots), across Europe and the US, and provides;
- information of logistics activity at cargo handling locations across the continents,
- information on volume of goods flowing across any market
- road transport activity of how goods are distributed across markets and main distribution road network
- road transport activity and longer term trends in the vicinity of any asset
- asset level competitive metrics such as population reach within 30min and 60min drive times, drive time weighted distance to cargo handling locations, access and density of transport distribution routes
- overlay with macroeconomic and demographic data and/or user specific data
- ML algorithms to identify clusters and tail risks across portfolios
- ability to benchmark an assets' competitive position compared to institutional quality logistics assets across markets
About Kania Advisors
Kania Advisors is an independent research and advisory firm focused exclusively on institutional real assets allocations and investment programmes. We provide advice and solutions to improve outcomes in real assets investment programmes. We conduct detailed industry research and custom studies typically focused on quantitative analysis and provide insights which form a critical part of a client's decision process.