Forecasting logistics rents with alternative data, Dallas/Ft. Worth
Using alternative data improves forecasts of logistics rents in a market, provides superior forward looking characteristics compared to traditional data such as employment in the sector and allows significant flexibility in assessing more granular submarket or specific asset geolocations . Alternative data is both more consistent and more timely giving users and investors near real-time nowcasting ability of logistics and distribution activity at any location.
In this note we use Dallas/Fort Worth to illustrate how alternative data can improve forecast accuracy of industrial/logistics rents by evaluating logistics activity in the market. The two most important drivers of rental growth in the sector are flow of goods through freight handling locations such as ports, airports, etc. within a market and road transport activity on major distribution highway network. (We have published several notes on the importance of freight volumes and road transport activity across markets and geolocations as main drivers of demand and rental growth in the sector, see previous posts).
In assessing and monitoring markets or geolocations, we
calculate distance and drive time weighted freight volumes within a market to an AOI (area of interest, which can be asset geolocation).
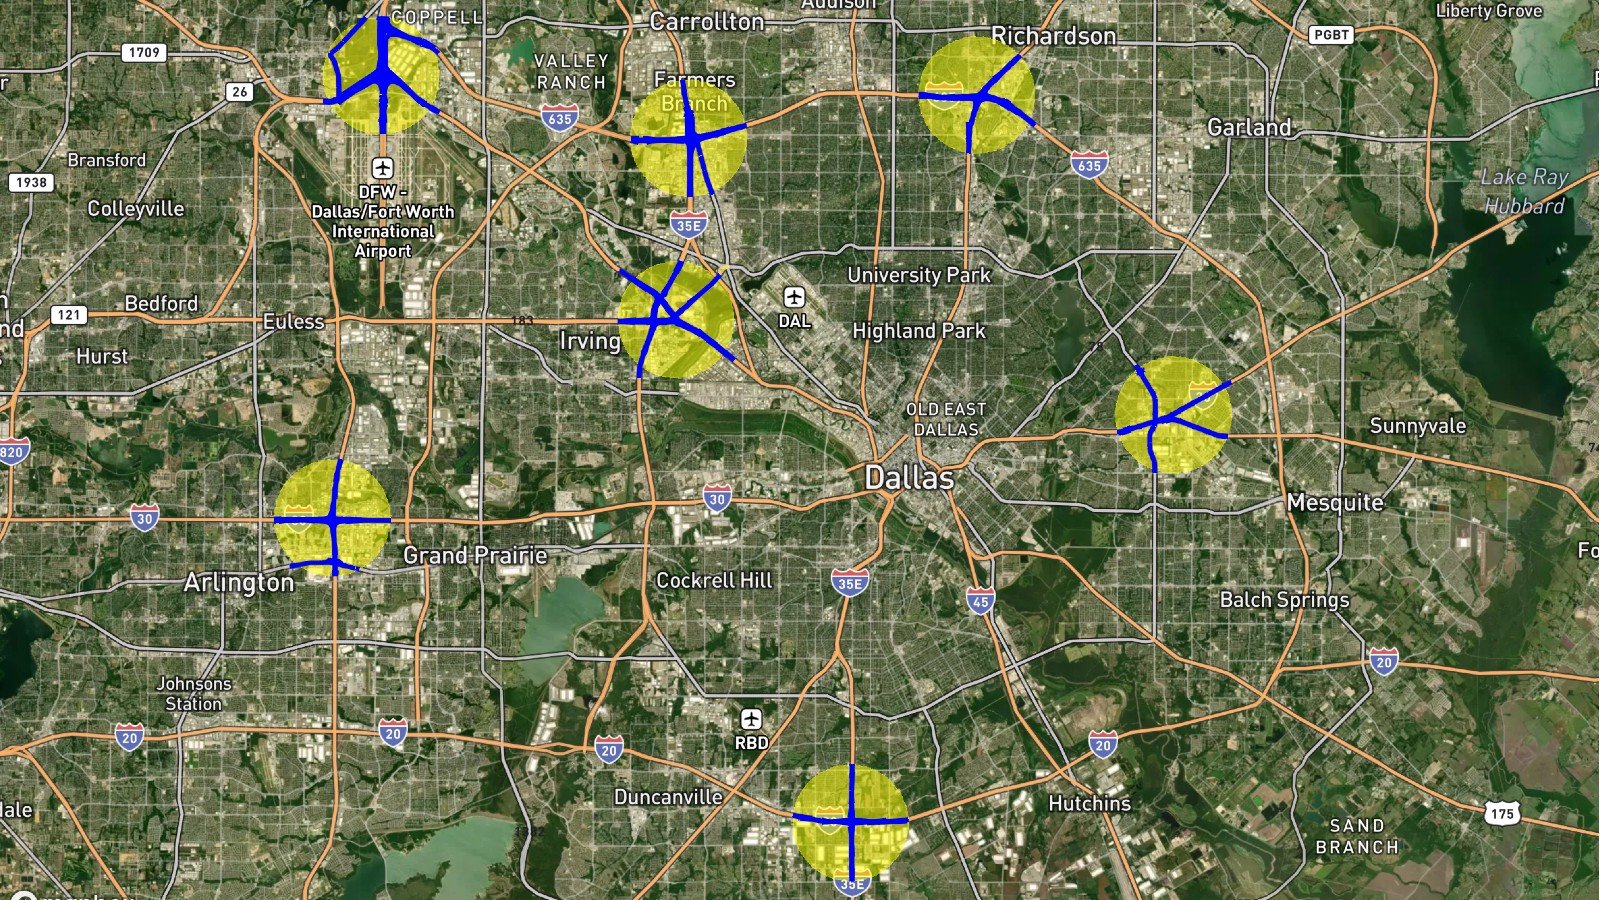
we measure transport activity within a number of key areas throughout the road distribution network, in this case as highlighted in figure 1; this provides logistics activity at both submarket level and for specific geolocations and when aggregated, for the market.
Figure 1. Geolocation areas across DFW monitored for transport activity flows
Model
We fit a model using our alternative data, CPI (given we model nominal rents market participants will incorporate CPI expectations) and inventory of industrial/logistics stock of assets in the market. As the model is defined in log variables, log(y) = a + B×log(X), the resulting coefficients are interpreted as sensitivities impacting rental growth (i.e. percent change in y (rent) given a one percent change in the value of x (each variable); FREIGHT is freight volumes, TVF is transport vehicles flows aggregated for road areas in figure 1.
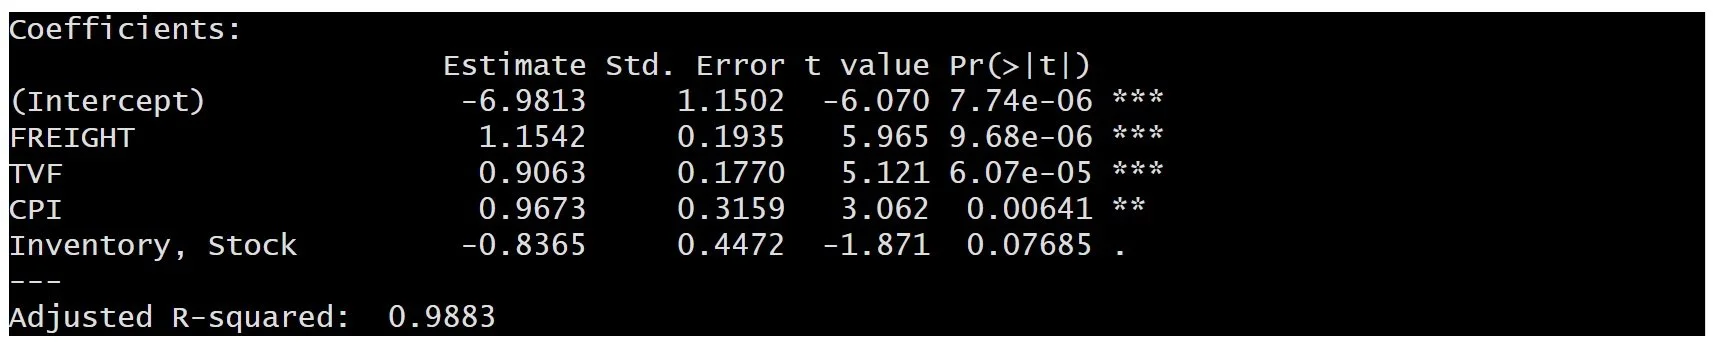
Freight Volumes and Transport Vehicle Flows are the most significant metrics to impact rental growth, which is as expected given both capture actual industrial/logistics demand and distribution activity. The variables are lagged by up to 1.5 years; this is consistent with our previous notes showing that freight volumes and road transport activity provide a 1-1.5 year leading indicator of logistics rents, measured both across US and European markets with similar impact. Generally, sensitivities in the output table are in line with expectations; one percent increase in freight volumes and/or transport distribution activity leads to ca equivalent impact on real rents (in this case); for markets with higher vacancy levels these sensitivities are generally lower as space needs to be absorbed before triggering further rental growth, and for markets with lower vacancy levels these sensitivities are generally higher due to more competitive and constrained conditions, see here Ahead of the curve, impact of freight volumes on logistics rents — Kania (kaniaadvisors.com) ). Inflation expectations, here represented by past actual CPI, are also significant to a magnitude that corresponds to rational pricing in line with general price level developments. Lastly, although significant at lower level, increase in supply/growth in market inventory/stock impacts real rents in a negative way, in this case by ca -0.8% for each 1% increase in overall stock.
We can observe that DFW market is more sensitive and responsive to demand drivers (freight volumes and transport vehicle flows; up to ca 2% aggregate sensitivity) compared to potential risks from oversupply at ca -0.8% sensitivity. However, this also implies that the market might be more exposed to any stagnation or declines in flows of goods.
Employment data and causality
We also estimated models including more traditional data typically used such as employment in the transportation and warehousing sector in the MSA (EMP_TRA), however once our alternative data is included, employment figures are not significant and do not add any useful information.
The question is of course if the alternative data is also leading trends in employment in the sector, if so, it would have better leading characteristics and provide higher degree of visibility regarding market dynamics and ultimately lead to better forecasts.
The tables below show output from Granger causality tests in the following structure
panel 1 shows causality test for employment (EMP_TRA) causing (A) freight volumes, and (B) transport vehicle flows
panel 2 shows causality test for (A) freight volumes, and (B) transport vehicle flows respectively causing employment in the sector (EMP_TRA)
Panel 1
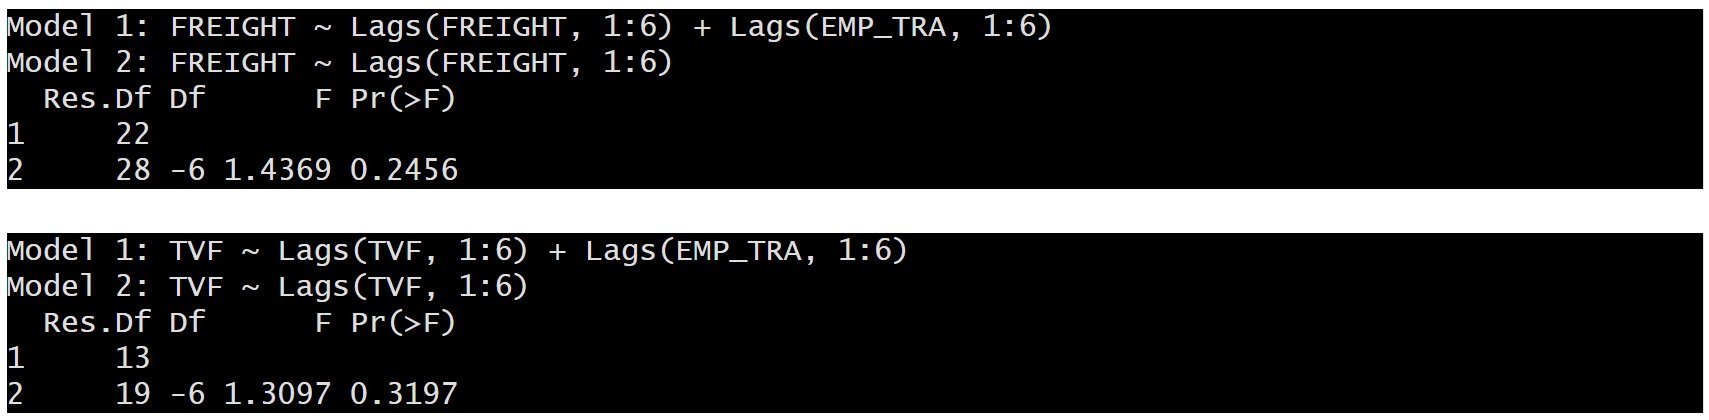
Employment in the sector does not Granger cause freight volumes nor transport vehicles flows
Panel 2
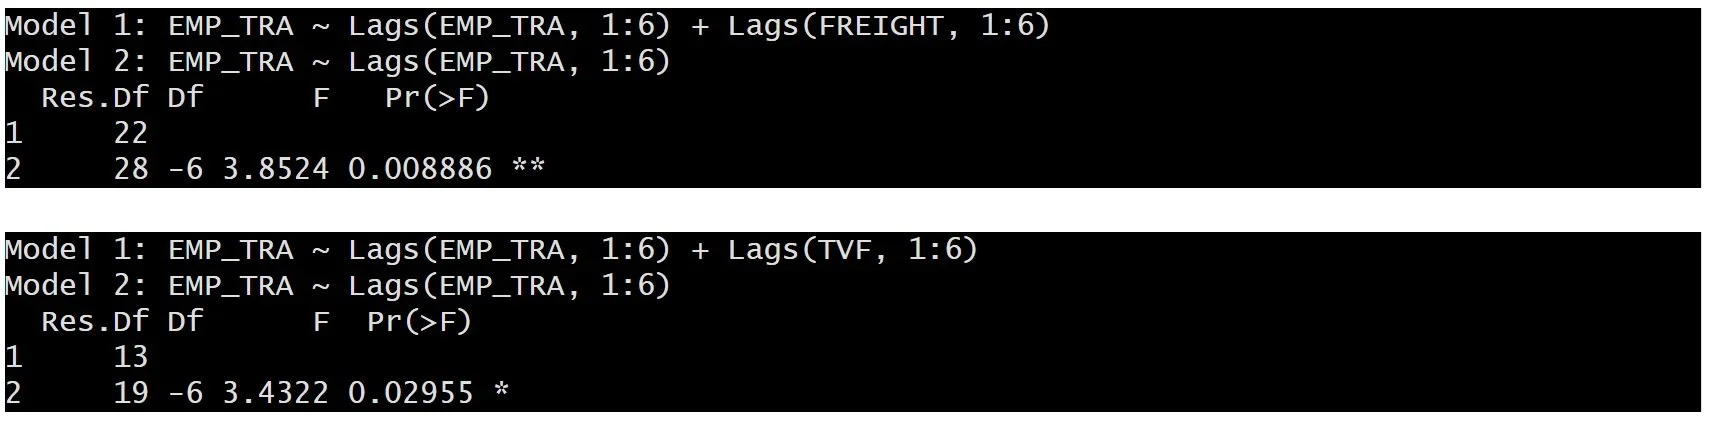
Both freight volumes and transport vehicles flows Granger cause employment in the sector.
Alternative data can significantly improve forecasts of logistics markets rental growth, provides earlier and more granular nowcasting information about activity critical to market dynamics and is significantly more flexible to identify and monitor sub-markets or specific asset geolocations.
Kania Data
Kania tracks logistics activity at ca 750 freight handling locations across US and Europe and transport vehicles flows across main markets for both regions. In addition, Kania can provide assessments and monitoring of logistics activity at any asset geolocation or portfolio of assets. If you would like to receive information about our data sets, case studies and how to implement our data into your business and workflows, please contact info@kaniaadvisors.com.