Active trading patterns in fundamental REIT funds
There is some evidence to suggest that fundamental REIT managers (“FRMs”) are largely trend followers. A large part of messaging from FRMs is comments on most recent performance of various sectors and messaging regarding expectations for secular trends or tailwinds in sectors that are already trending. However, the secular trends messaging appears to stagnate only once the relevant sector’s performance stagnates, i.e. there is limited forward-looking aspect. As an example, industrials/logistics were a high conviction sector across FRM platforms for a long time both pre- and post-COVID. The sector delivered strong performance and the strong convictions were largely based on (communicated as) secular trends of e-commerce gaining market share. Both the strong convictions and messaging reduced significantly only as industrial/logistics sector performance reduced or normalized relative to other sectors. This despite the fact that the driver for the conviction, expectations of e-commerce gaining market share, has not changed. Recently, another sector has been identified as high conviction, data centers, mainly based on AI related market growth and developments. The sector has generated attractive returns over some time, i.e. can be viewed as already trending. As convictions have grown for data centers more recent performance in the sector both generally and within listed REITs has stagnated, which might lead to reduced “secular trends” messaging from FRMs in the coming months.
These dynamics of going from strong convictions that appear to reduce meaningfully only when the relevant sector’s performance falls within a more normalized range, could imply a level of trend following supported by fundamental messaging.
In order to assess this potential dynamic we evaluate active trading patterns of listed REIT funds (LRFs) based on reported quarterly fund holdings. The results are based on 20 listed REIT funds between 2019:Q4 and 2024:Q1. The time frame is 4.5 years however it captures meaningful market shifts and gyrations across global REITs during this time both structural and cyclical.
We focus on active trading rather than purely reported sector allocations given changes in sector allocations between two reporting periods are also a function of general market movements and not necessarily a result of active decisions (e.g. if two sectors have the same allocation weights but different performance during a period, the end weights will change accordingly even with no trading during the period). Given changes between any two periods can be impacted by a number of factors including individual stock performance, fund flows, liquidity adjustments etc. we isolate trading activity in the following way;
for each fund at each quarterly starting date we construct a portfolio based on the reported individual stock holdings and “hold” that portfolio to the end of the period; this gives an estimate of the quarter-end composition based on performance of individual stocks purely due to market movements if there were no active trades.
we aggregate individual stocks to their respective sector classification which gives the fund’s sector exposures
we compare this to the actual reported holdings (and sector weights) of the relevant quarter-end; the difference between the reported holdings (sectors) and the ones calculated in step 1, must be due to active trading during the period. This is the metric that we evaluate, the isolated active trading pattern.
In addition, given the similarities in information flow and higher degree of cyclicality within the sector compared to general equities, there should also be higher degree of FRMs doing roughly the same thing at roughly the same times. Charts below illustrate sector level trading pattern activity across the funds for seven main sectors; data centers, industrial/logistics, lodging/resorts, office, residential, retail and self-storage. The grey areas are the 33rd-67th percentile range, the blue areas are the median range (45th-55th percentile) and the y-axis represents the percent change (increase/decrease) of sector weight due to active trading.
As can be seen there are similarities and a level of coordinated trading activity across individual sectors, implying similarity in information processing or interpretation of market conditions; again, this is as expected given higher degree of cyclical dependence on the longer underlying real estate cycle compared to the shorter business cycle).
Data Centers

Industrial/Logistics

Lodging/Resorts

Office

Residential

Retail

Self-Storage

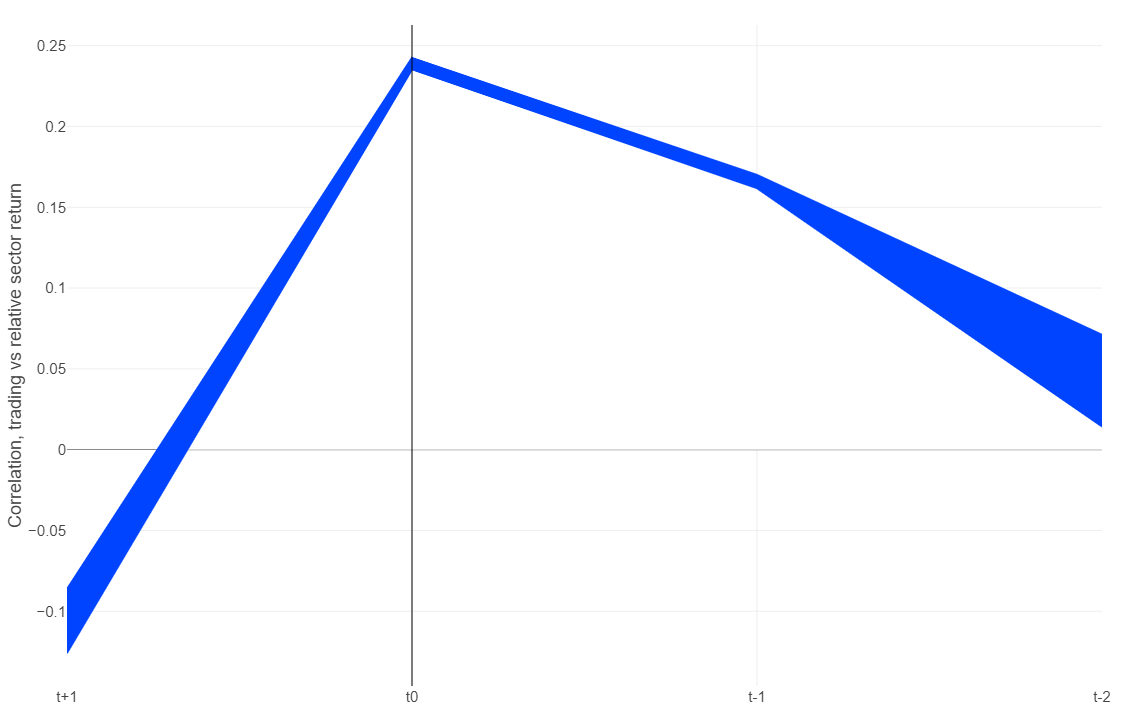
In order to assess if these trading patterns lead (anticipate) or lag (follow) sector level performance, we construct a panel data set combining all trading patterns from all sectors across all funds and all time periods, and compare this to same-period sector returns (t0), lagged sector returns for the past two quarters (t-1, t-2) and lead sector returns for the following quarter (t+1). The comparison is based on correlation between trading patterns and sector returns.
As trends can be identified and classified in various ways, we focus on the simplest definitions being;
annualised average return of the sector during a quarter compared to the same for the benchmark (this eliminates the point-to-point calculation between two dates)
sharpe-ratio of the sector during a quarter compared to the same for the benchmark as FRMs are likely to take sector risk into account
There is variation of the correlation metrics across individual funds and sectors, however given the level of panel data we do not expect high overall correlations but instead the patterns that do emerge should be viewed as trading activity that FRMs carry out in a statistically repeatable way irrespective of sector, time period, market conditions, etc. This is also the primary dynamic that we want to assess.
As the two charts below illustrate, in both cases the peak correlation between trading activity and sector returns is at time t0 (as we can only measure fixed periods, i.e. we cannot track daily trading, this should be viewed as “during the quarter/period” as FRMs make trading decisions daily). As the second chart shows (based on sharpe-ratio), the correlation is generally higher and the impact is also largely persistent during t-1, which would imply that FRMs focus on risk-adjusted sector performance in the past 1-2 quarters for trading decisions that impact sector exposures. In both cases, average sector return and risk-adjusted sector return, there does not appear to be any correlation between what trading FRMs have implemented, i.e. how portfolios are adjusted through trading activity, and future sector returns.
The results would indicate that active trading decisions in listed REIT funds are driven by trend-following behaviour and would also be consistent with the general messaging from FRMs which focuses predominantly on commentaries of most recent sector performance, followed by “secular trends” if a sector trend persists and reduces when the relevant sector’s performance falls to a normalised range relative to other sectors.
Cor. trading to period sector return

Cor. trading to period sector Sharpe-ratio
About Kania Advisors
Kania Advisors is an independent research and advisory firm focused exclusively on institutional real assets allocations and investment programmes. We provide advice and solutions to improve outcomes in real assets investment programmes. We conduct detailed industry research and custom studies typically focused on quantitative analysis and provide insights which form a critical part of a client's decision process.